JEE Main 2020 — Redox Reactions Question with Solution
JEE Main 2020 (03 Sep Shift 2)
Question
of is taken in a beaker and to it of is added in steps of and the is continuously measured. Which of the following graphs correctly depicts the change in ?
Choose an option
Show full solutionCorrect option: C
Correct answer
C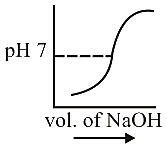
Step-by-step explanation
At equivalence point is and increases with addition of .
Practice this on the real CBT interface
Solve this JEE Main question (and the rest of the Redox Reactions chapter) on PrepSharp's TCS iON-style CBT player — with timer, bookmarks and session analytics.
Solve interactively →About this question
This is a previous-year question from JEE Main 2020, covering the Redox Reactions chapter of Chemistry. PrepSharp catalogues every PYQ from JEE Main with a verified answer key and step-by-step solution prepared by IIT alumni — so you can search by chapter, topic or year and revise efficiently.