JEE Main 2021 — Nuclear Physics Question with Solution
JEE Main 2021 (31 Aug Shift 1)
Question
A sample of a radioactive nucleus disintegrates to another radioactive nucleus which in turn disintegrates to some other stable nucleus Plot of a graph showing the variation of number of atoms of nucleus vesus time is : (Assume that at there are no atoms in the sample)
Choose an option
Show full solutionCorrect option: C
Correct answer
C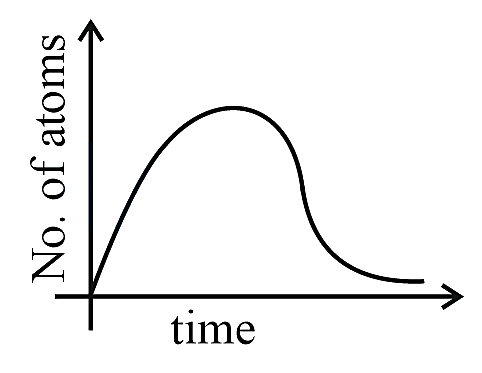
Step-by-step explanation
No. of nuclei of B is initially zero and finally zero.
It will reach a maximum value at some intermediate
time.
It will reach a maximum value at some intermediate
time.
Practice this on the real CBT interface
Solve this JEE Main question (and the rest of the Nuclear Physics chapter) on PrepSharp's TCS iON-style CBT player — with timer, bookmarks and session analytics.
Solve interactively →About this question
This is a previous-year question from JEE Main 2021, covering the Nuclear Physics chapter of Physics. PrepSharp catalogues every PYQ from JEE Main with a verified answer key and step-by-step solution prepared by IIT alumni — so you can search by chapter, topic or year and revise efficiently.