JEE Main 2008 — Center of Mass Momentum and Collision Question with Solution
JEE Main 2008
Question
A thin rod of length ' ' is lying along the -axis with its ends at and . Its linear density (mass/length) varies with ask , where can be zero or any positive number. If the position of the centre of mass of the rod is plotted against ' ', which of the following graphs best approximates the dependence of on ?
Choose an option
Show full solutionCorrect option: A
Correct answer
A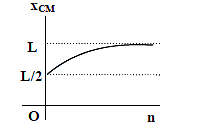
Step-by-step explanation
Practice this on the real CBT interface
Solve this JEE Main question (and the rest of the Center of Mass Momentum and Collision chapter) on PrepSharp's TCS iON-style CBT player — with timer, bookmarks and session analytics.
Solve interactively →About this question
This is a previous-year question from JEE Main 2008, covering the Center of Mass Momentum and Collision chapter of Physics. PrepSharp catalogues every PYQ from JEE Main with a verified answer key and step-by-step solution prepared by IIT alumni — so you can search by chapter, topic or year and revise efficiently.