JEE Main 2026 — Oscillations Question with Solution
JEE Main 2026 (22 January Shift 2)
Question
Using a simple pendulum experiment is determind by measuring its time period . Which of the following plots represent the correct relation between the pendulum length and time period ?
Choose an option
Show full solutionCorrect option: B
Correct answer
B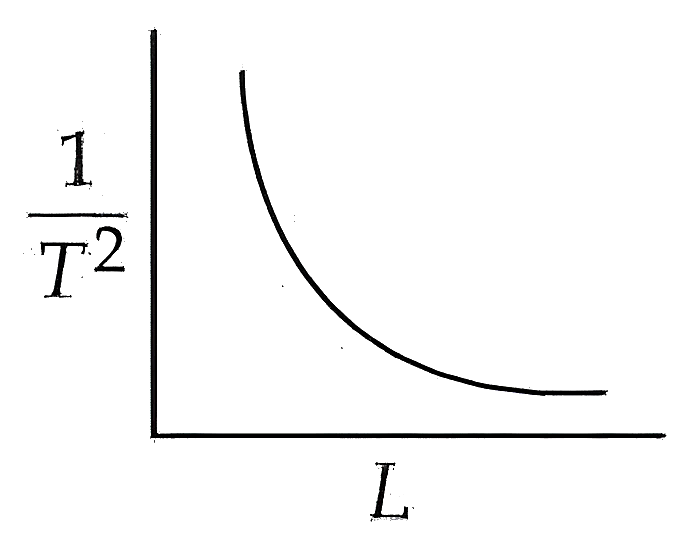
Step-by-step explanation
The time period of a simple pendulum of length is given by the formula:
Squaring both sides, we get:
Rearranging the equation to find the relationship between and :
Let and . The equation becomes:
where is a constant.
This is the equation of a rectangular hyperbola in the first quadrant.
As increases, decreases non-linearly, approaching the axes asymptotically.
Comparing this with the given plots, option (2) correctly represents a hyperbolic relationship between and .
Practice this on the real CBT interface
Solve this JEE Main question (and the rest of the Oscillations chapter) on PrepSharp's TCS iON-style CBT player — with timer, bookmarks and session analytics.
Solve interactively →About this question
This is a previous-year question from JEE Main 2026, covering the Oscillations chapter of Physics. PrepSharp catalogues every PYQ from JEE Main with a verified answer key and step-by-step solution prepared by IIT alumni — so you can search by chapter, topic or year and revise efficiently.