JEE Main 2015 — Oscillations Question with Solution
JEE Main 2015 (04 Apr)
Question
For a simple pendulum, a graph is plotted between its kinetic energy (K.E.) and potential energy (P.E.) against its displacement d. which one of the following represents these correctly? (graphs are schematic and not drawn to scale)
Choose an option
Show full solutionCorrect option: C
Correct answer
C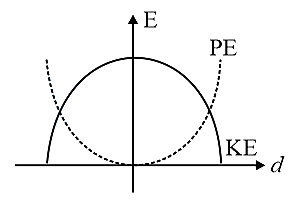
Step-by-step explanation
For simple pendulum performing the simple harmonic motion, displacement, ,
This represents a downward parabola, , . . This represents an upward parabola. On plotting graphs of potential energy & kinetic energy.
This represents a downward parabola, , . . This represents an upward parabola. On plotting graphs of potential energy & kinetic energy.
Practice this on the real CBT interface
Solve this JEE Main question (and the rest of the Oscillations chapter) on PrepSharp's TCS iON-style CBT player — with timer, bookmarks and session analytics.
Solve interactively →About this question
This is a previous-year question from JEE Main 2015, covering the Oscillations chapter of Physics. PrepSharp catalogues every PYQ from JEE Main with a verified answer key and step-by-step solution prepared by IIT alumni — so you can search by chapter, topic or year and revise efficiently.